Images
Full JWST-MIRI/MRS spectrum of the compact disk DR Tau (Temmink et al. 2024a, b). Emission lines of various molecular species are visible: CO, H₂O, OH, CO₂, HCN, and C₂H₂. The different colours indicate the MIRI subbands (denoted by ‘A’, ‘B’, and ‘C’), while the black line indicates the estimated continuum level.
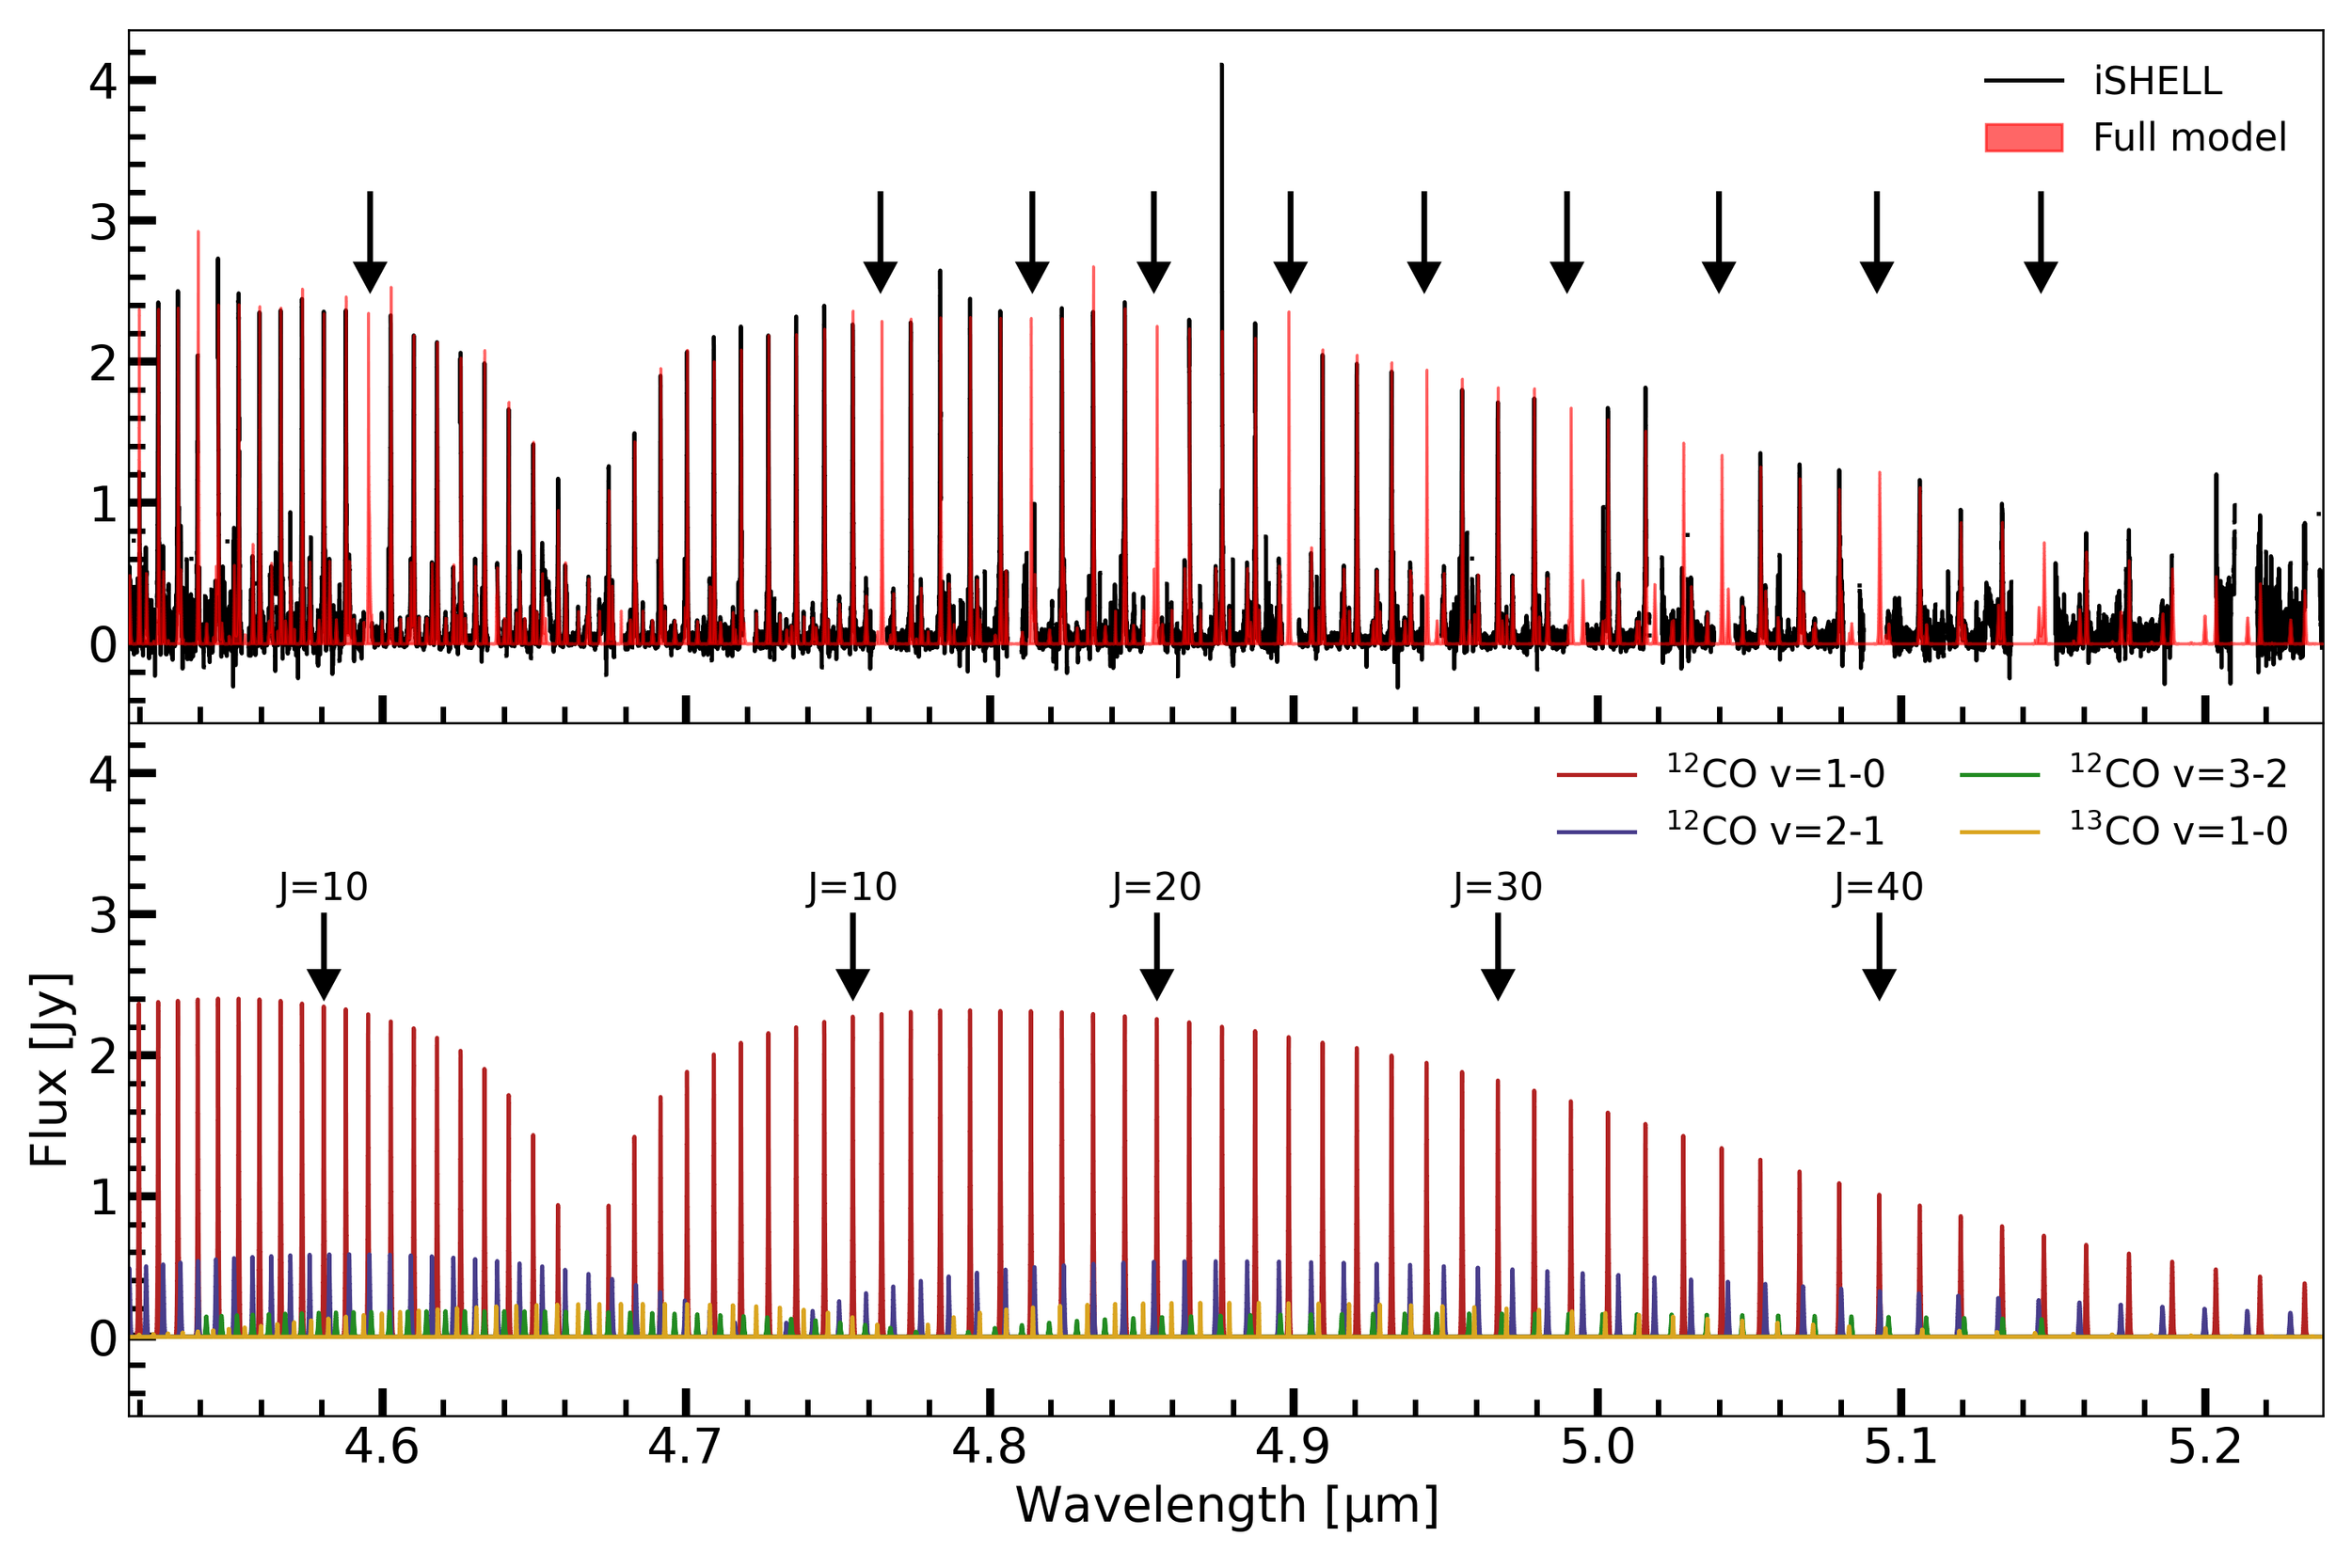
Full model of the CO ro-vibrational spectrum of DR Tau (Temmink et al. 2024a), observed with the IRTF-iSHELL instrument. Displayed are various vibrational bands of ¹²CO (v=1-0, v=2-1, and v=3-2) and ¹³CO (v=1-0).
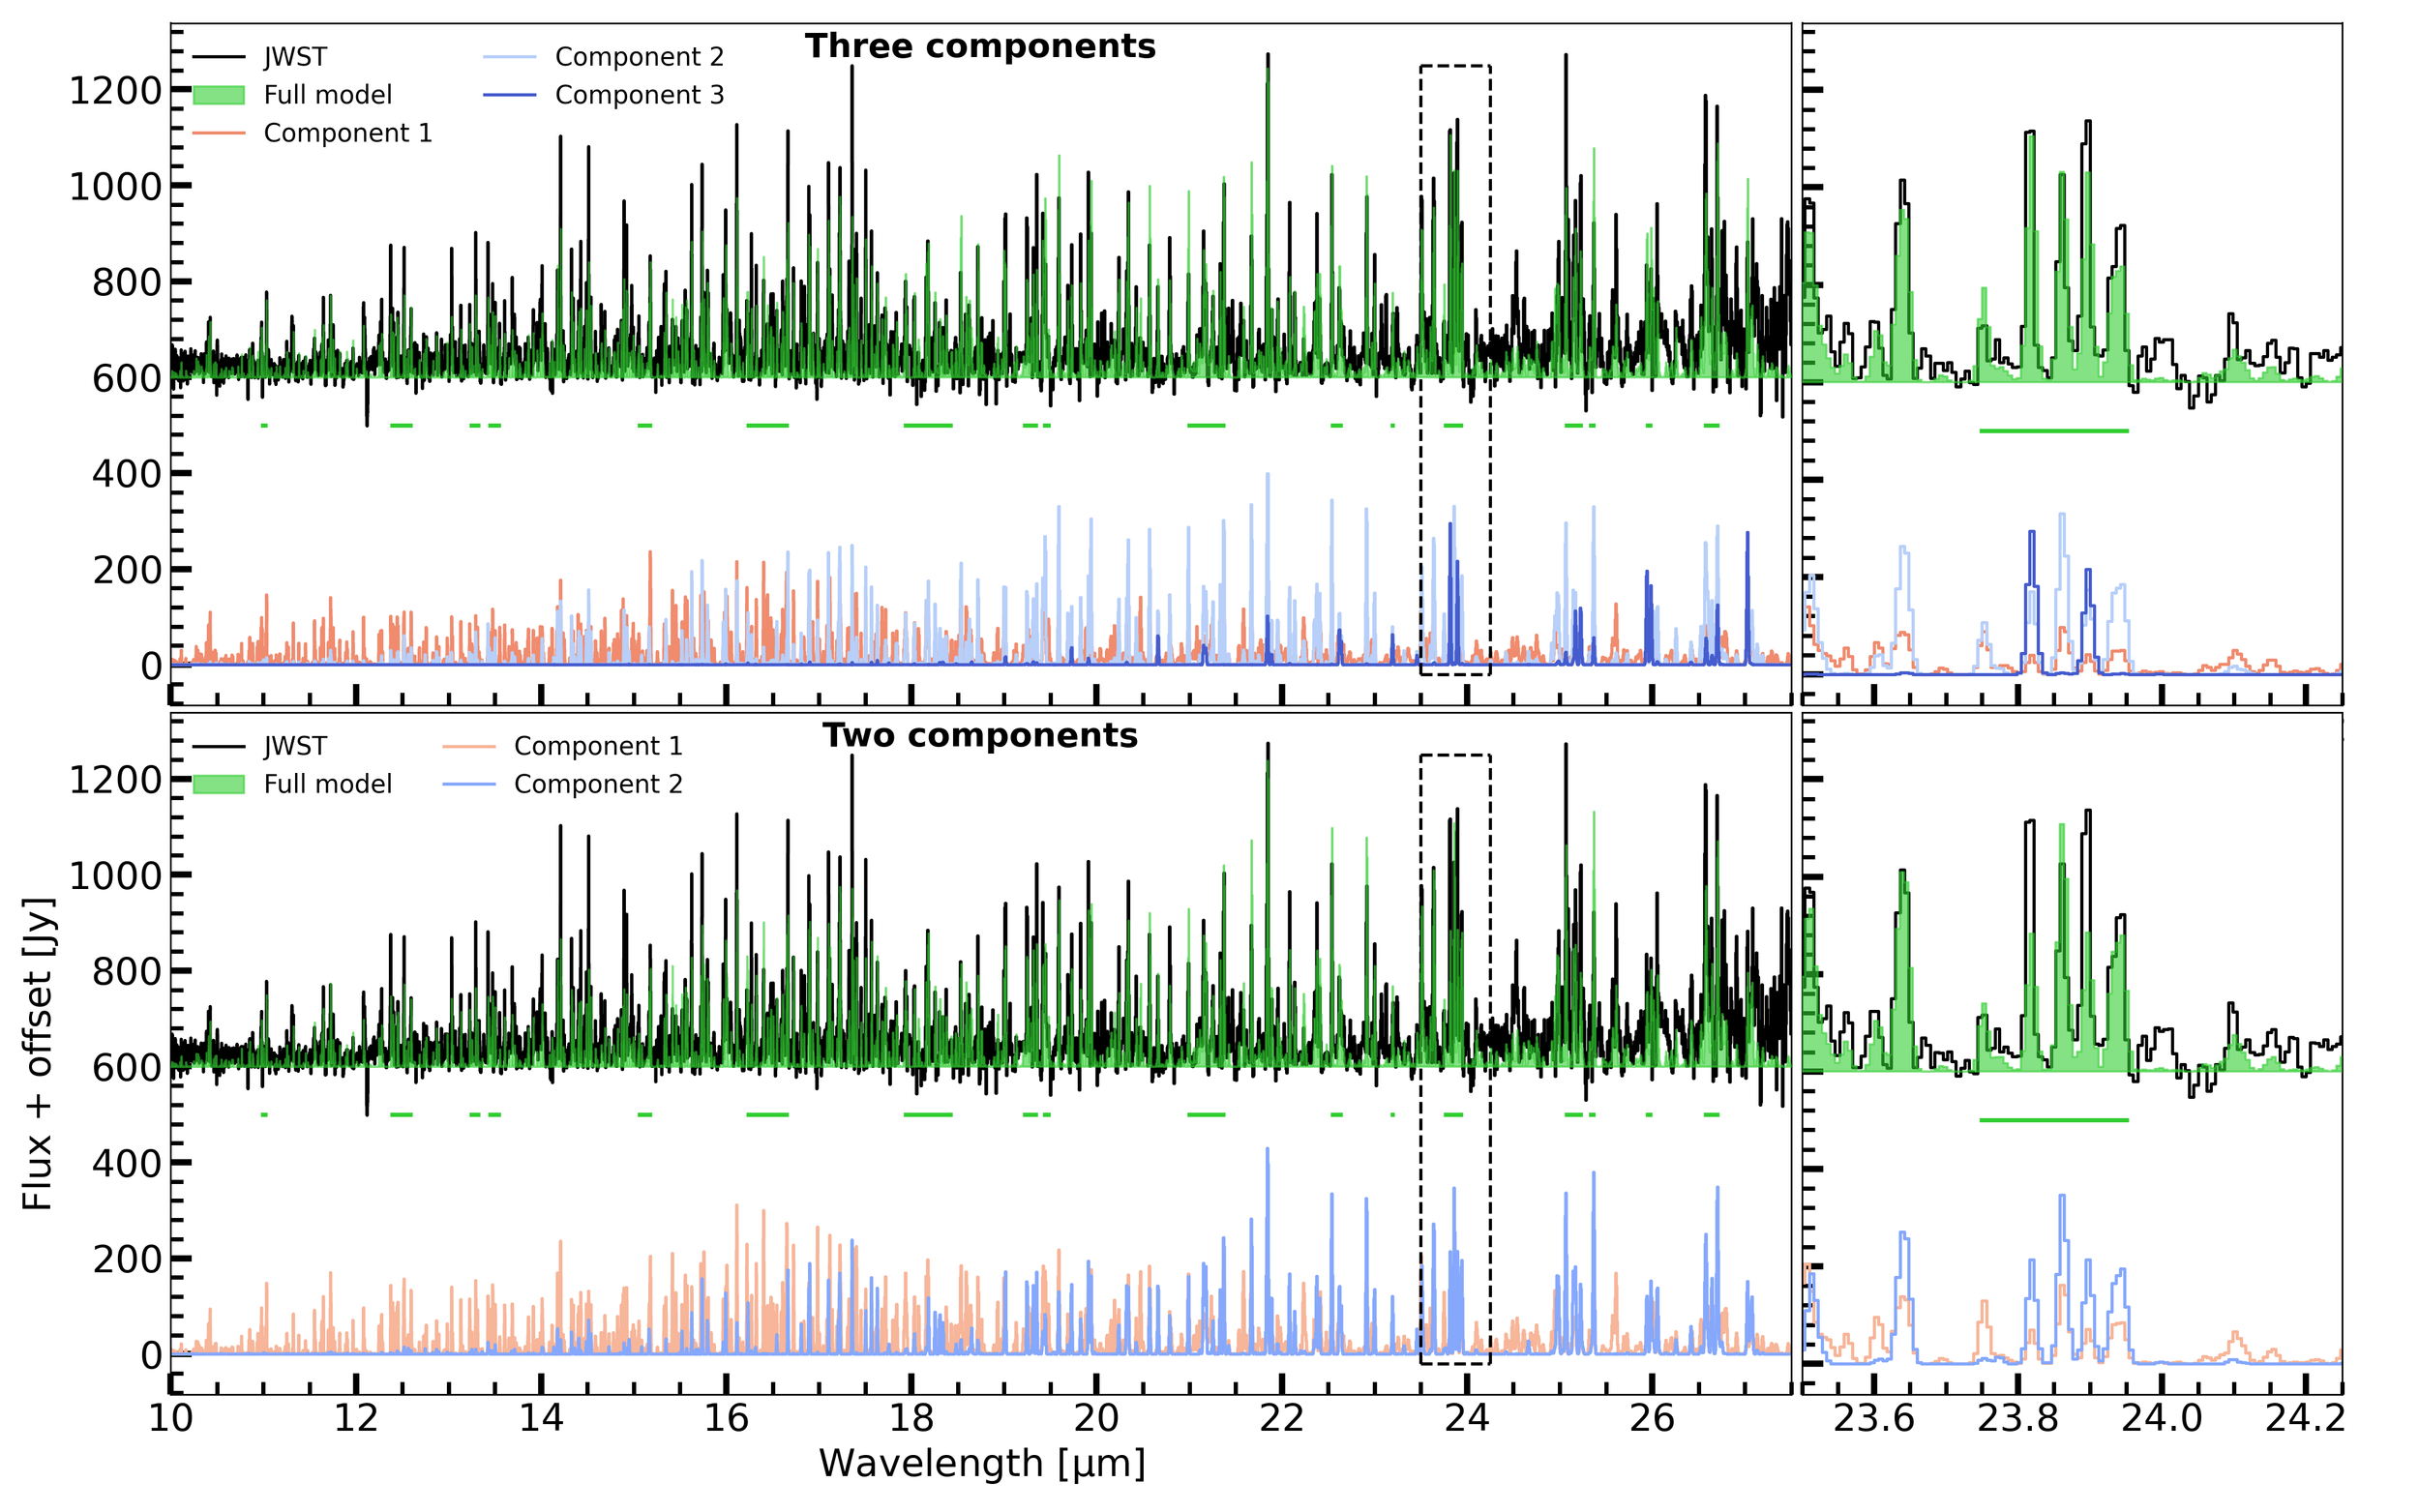
Comparison between a three component H2O fit and a two component fit (Temmink et al. 2024b). The zoom-ins on the 23.50-24.25 μm region show the need for a third, cold component (T~180 K).
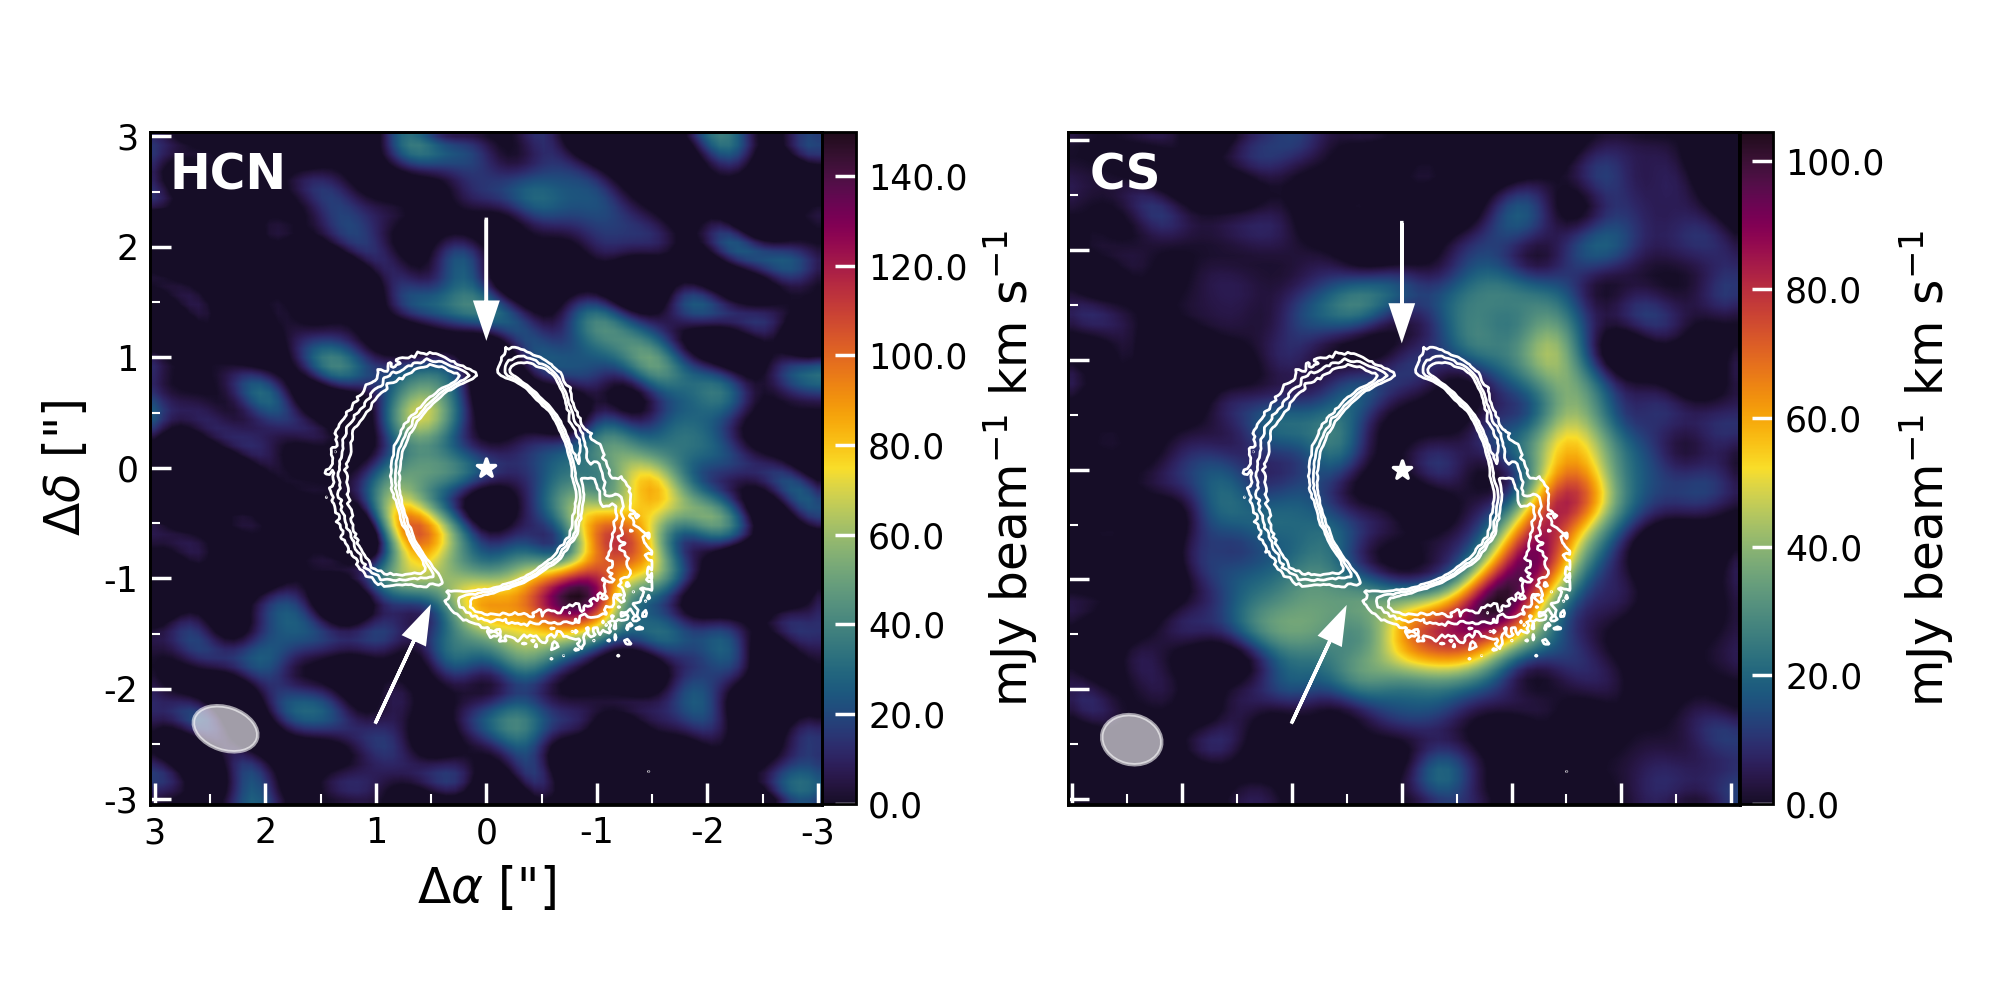
ALMA images of the HCN J=4-3 and CS J=7-6 transitions in the HD 142527 disk (Temmink et al. 2023). The white contours display the scattered light emission, while the arrows point to shadows created by the misaligned inner disk. The shadows and molecular emission appear to be connected, suggesting that the molecular emission layer (of HCN and CS) may be shadowed by the misaligned inner disk as well, creating an azimuthal temperature variation.


